Bayes factor bullet charts (ligo.skymap.plot.bayes_factor)
Bullet charts for Bayes factors.
- ligo.skymap.plot.bayes_factor.plot_bayes_factor(logb, values=(1, 3, 5), labels=('', 'strong', 'very strong'), xlim=7, title=None, palette='RdYlBu', var_label='B')[source]
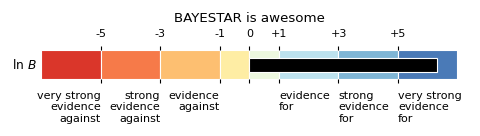
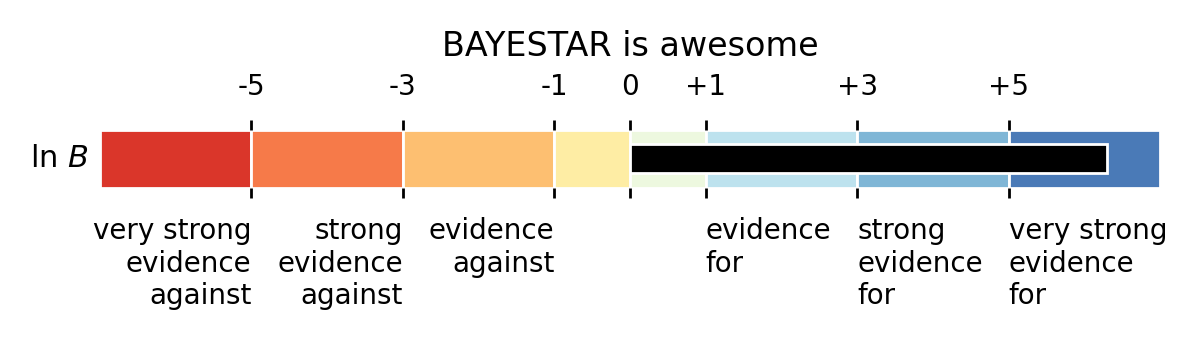
Visualize a Bayes factor as a bullet graph.
Make a bar chart of a log Bayes factor as compared to a set of subjective threshold values. By default, use the thresholds from Kass & Raftery (1995).
- Parameters:
- logbfloat
The natural logarithm of the Bayes factor.
- valueslist
A list of floating point values for human-friendly confidence levels.
- labelslist
A list of string labels for human-friendly confidence levels.
- xlimfloat
Limits of plot (
-xlimto+xlim).- titlestr
Title for plot.
- palettestr
Color palette.
- var_labelstr
The variable symbol used in plotting
- Returns:
- figMatplotlib figure
- axMatplotlib axes
Examples
from ligo.skymap.plot.bayes_factor import plot_bayes_factor
plot_bayes_factor(6.3, title='BAYESTAR is awesome')
(
Source code,png,hires.png,pdf)