2D All-Sky Plots (ligo-skymap-plot)
Example
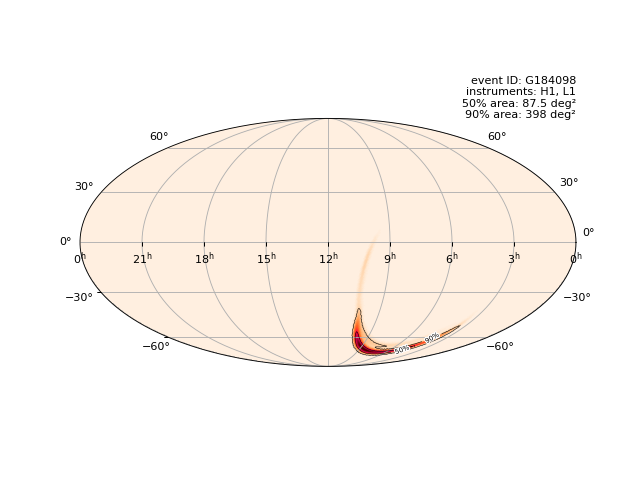
To plot the localization for GW150914:
$ curl -OL https://dcc.ligo.org/public/0122/P1500227/012/bayestar_gstlal_C01.fits.gz
$ ligo-skymap-plot bayestar_gstlal_C01.fits.gz -o bayestar.png --annotate --contour 50 90
(Source code, png, hires.png, pdf)
Plot an all-sky map on a Mollweide projection. By default, plot in celestial coordinates (RA, Dec).
To plot in geographic coordinates (longitude, latitude) with major
coastlines overlaid, provide the --geo flag.
Public-domain cartographic data is courtesy of Natural Earth and processed with MapShaper.
usage: ligo-skymap-plot [-h] [-o FILE.{pdf,png}] [--colormap CMAP]
                        [--help-colormap] [--figure-width INCHES]
                        [--figure-height INCHES] [--dpi PIXELS]
                        [--transparent [TRANSPARENT]] [--version]
                        [-l CRITICAL|ERROR|WARNING|INFO|DEBUG|NOTSET]
                        [--annotate] [--contour PERCENT [PERCENT ...]]
                        [--colorbar] [--radec deg deg]
                        [--inj-database FILE.sqlite] [--geo]
                        [--projection {mollweide,aitoff,globe,zoom}]
                        [--projection-center CENTER] [--zoom-radius RADIUS]
                        [INPUT.fits[.gz]]
Positional Arguments
- INPUT.fits[.gz]
Input FITS file
Default:
-
Named Arguments
- --version
show program’s version number and exit
- -l, --loglevel
Default:
INFO- --annotate
annotate plot with information about the event
Default:
False- --contour
plot contour enclosing this percentage of probability mass [may be specified multiple times, default: none]
- --colorbar
Show colorbar
Default:
False- --radec
right ascension (deg) and declination (deg) to mark
Default:
[]- --inj-database
read injection positions from database
- --geo
Use a terrestrial reference frame with coordinates (lon, lat) instead of the celestial frame with coordinates (RA, dec) and draw continents on the map
Default:
False- --projection
Possible choices: mollweide, aitoff, globe, zoom
Projection style
Default:
'mollweide'- --projection-center
Specify the center for globe and zoom projections, e.g. 14h 10d
- --zoom-radius
Specify the radius for zoom projections, e.g. 4deg
figure options
Options that affect figure output format
- -o, --output
output file, or - to plot to screen
Default:
-- --colormap
Possible choices: magma, inferno, plasma, viridis, cividis, twilight, twilight_shifted, turbo, berlin, managua, vanimo, Blues, BrBG, BuGn, BuPu, CMRmap, GnBu, Greens, Greys, OrRd, Oranges, PRGn, PiYG, PuBu, PuBuGn, PuOr, PuRd, Purples, RdBu, RdGy, RdPu, RdYlBu, RdYlGn, Reds, Spectral, Wistia, YlGn, YlGnBu, YlOrBr, YlOrRd, afmhot, autumn, binary, bone, brg, bwr, cool, coolwarm, copper, cubehelix, flag, gist_earth, gist_gray, gist_heat, gist_ncar, gist_rainbow, gist_stern, gist_yarg, gnuplot, gnuplot2, gray, hot, hsv, jet, nipy_spectral, ocean, pink, prism, rainbow, seismic, spring, summer, terrain, winter, Accent, Dark2, Paired, Pastel1, Pastel2, Set1, Set2, Set3, tab10, tab20, tab20b, tab20c, grey, gist_grey, gist_yerg, Grays, magma_r, inferno_r, plasma_r, viridis_r, cividis_r, twilight_r, twilight_shifted_r, turbo_r, berlin_r, managua_r, vanimo_r, Blues_r, BrBG_r, BuGn_r, BuPu_r, CMRmap_r, GnBu_r, Greens_r, Greys_r, OrRd_r, Oranges_r, PRGn_r, PiYG_r, PuBu_r, PuBuGn_r, PuOr_r, PuRd_r, Purples_r, RdBu_r, RdGy_r, RdPu_r, RdYlBu_r, RdYlGn_r, Reds_r, Spectral_r, Wistia_r, YlGn_r, YlGnBu_r, YlOrBr_r, YlOrRd_r, afmhot_r, autumn_r, binary_r, bone_r, brg_r, bwr_r, cool_r, coolwarm_r, copper_r, cubehelix_r, flag_r, gist_earth_r, gist_gray_r, gist_heat_r, gist_ncar_r, gist_rainbow_r, gist_stern_r, gist_yarg_r, gnuplot_r, gnuplot2_r, gray_r, hot_r, hsv_r, jet_r, nipy_spectral_r, ocean_r, pink_r, prism_r, rainbow_r, seismic_r, spring_r, summer_r, terrain_r, winter_r, Accent_r, Dark2_r, Paired_r, Pastel1_r, Pastel2_r, Set1_r, Set2_r, Set3_r, tab10_r, tab20_r, tab20b_r, tab20c_r, grey_r, gist_grey_r, gist_yerg_r, Grays_r, cylon, cylon_r
matplotlib colormap
Default:
cylon- --help-colormap
show supported values for –colormap and exit
- --figure-width
width of figure in inches
Default:
8- --figure-height
height of figure in inches
Default:
6- --dpi
resolution of figure in dots per inch
Default:
300- --transparent
Save image with transparent background
Default:
0