Making a scatter plot for a population of events
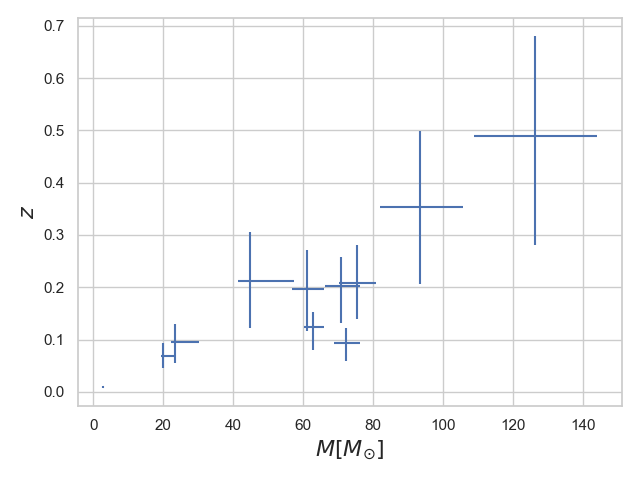
With PESummary you can scatter plot displaying the distributions of different parameters estimated from the gravitational waves reeleased by the LIGO Collaboration. Here we show an example for the redshift vs total mass distribution for all the GWTC-1 data. This is done including errorbars on the plot. Below the image example and the script used to produce it.
 1# Here we will show you how to create a population scatter plot using the
 2# summarypublication executable for the GWTC1 data release.
 3
 4# First, we need to download the data from the DCC
 5curl -O https://dcc.ligo.org/public/0157/P1800370/004/GWTC-1_sample_release.tar.gz
 6tar -xf GWTC-1_sample_release.tar.gz
 7
 8# Lets remove the priorChoice files as they do not contain posterior samples
 9FILES_TO_REMOVE=($(ls ./GWTC-1_sample_release/*priorChoices*))
10for i in ${FILES_TO_REMOVE[@]}; do
11    rm ${i}
12done
13
14# Now lets get a list of all of the files
15FILES=($(ls ./GWTC-1_sample_release/*_GWTC-1.hdf5))
16
17# Now lets get a list of labels
18LABELS=()
19for i in ${FILES[@]}; do
20    label=`python -c "print('${i}'.split('_GWTC-1.hdf5')[0])"`
21    LABELS+=(`python -c "print('${label}'.split('./GWTC-1_sample_release/')[1])"`)
22done
23
24# Now lets make the population plot
25summarypublication --plot population_scatter_error \
26                   --webdir ./GWTC-1_sample_release \
27                   --samples ${FILES[@]} \
28                   --labels ${LABELS[@]} \
29                   --parameters total_mass redshift \